
Accuracy dashboard
Track quote accuracy over time and identify improvement opportunities.
The Accuracy Dashboard helps you track quote accuracy over time, enabling data-driven improvements to your estimating process.
Why accuracy matters
Every quote is a prediction. The Accuracy Dashboard helps you answer critical questions:
- Are your estimates reliable? See whether your quoted times and material usage match reality.
- Where are the gaps? Identify materials, machines, or services where estimates consistently miss the mark.
- Is your process improving? Track accuracy trends over time to validate process changes.
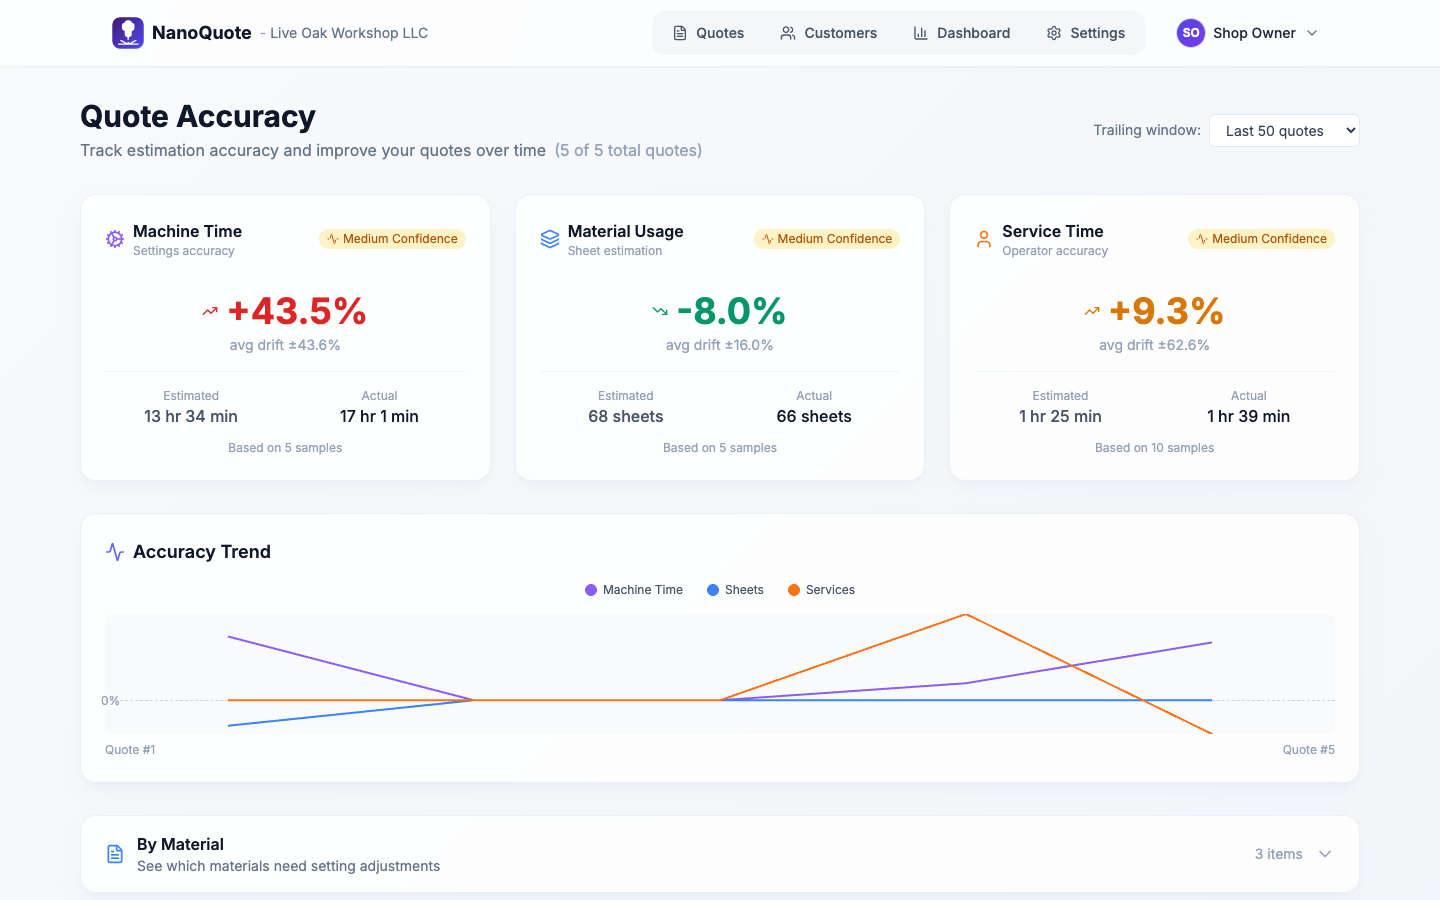
Overview metrics
The dashboard displays three key accuracy metrics:
Machine Time Accuracy
Compares estimated cutting time to actual machine time recorded when completing quotes. A positive drift means you're underestimating; negative means overestimating.
Material Usage Accuracy
Tracks how closely your sheet count estimates match actual sheets consumed. This accounts for material waste, nesting efficiency, and scrap rates.
Service Time Accuracy
Measures accuracy of time-based service estimates (e.g., deburring, finishing, powder coating) against actual labor hours.
Understanding drift
Drift percentage shows how far off your estimates are on average:
- 0%: Perfect accuracy
- +10%: Actual values are 10% higher than estimates (underestimating)
- -10%: Actual values are 10% lower than estimates (overestimating)
Confidence levels
Each metric includes a confidence indicator based on sample size:
| Confidence | Sample Size | Meaning |
|---|---|---|
| Low | < 5 quotes | Early data, patterns may not be reliable |
| Medium | 5-20 quotes | Emerging patterns, worth monitoring |
| High | > 20 quotes | Statistically meaningful trends |
Trailing window
Use the Trailing window selector to control how many recent quotes are analyzed. Options include:
- Last 10 quotes - Quick snapshot of recent performance
- Last 25 quotes - Balanced view of trends
- Last 50 quotes - Broader pattern analysis
- Last 100 quotes - Long-term accuracy assessment
Smaller windows react faster to changes; larger windows provide more stable trends.
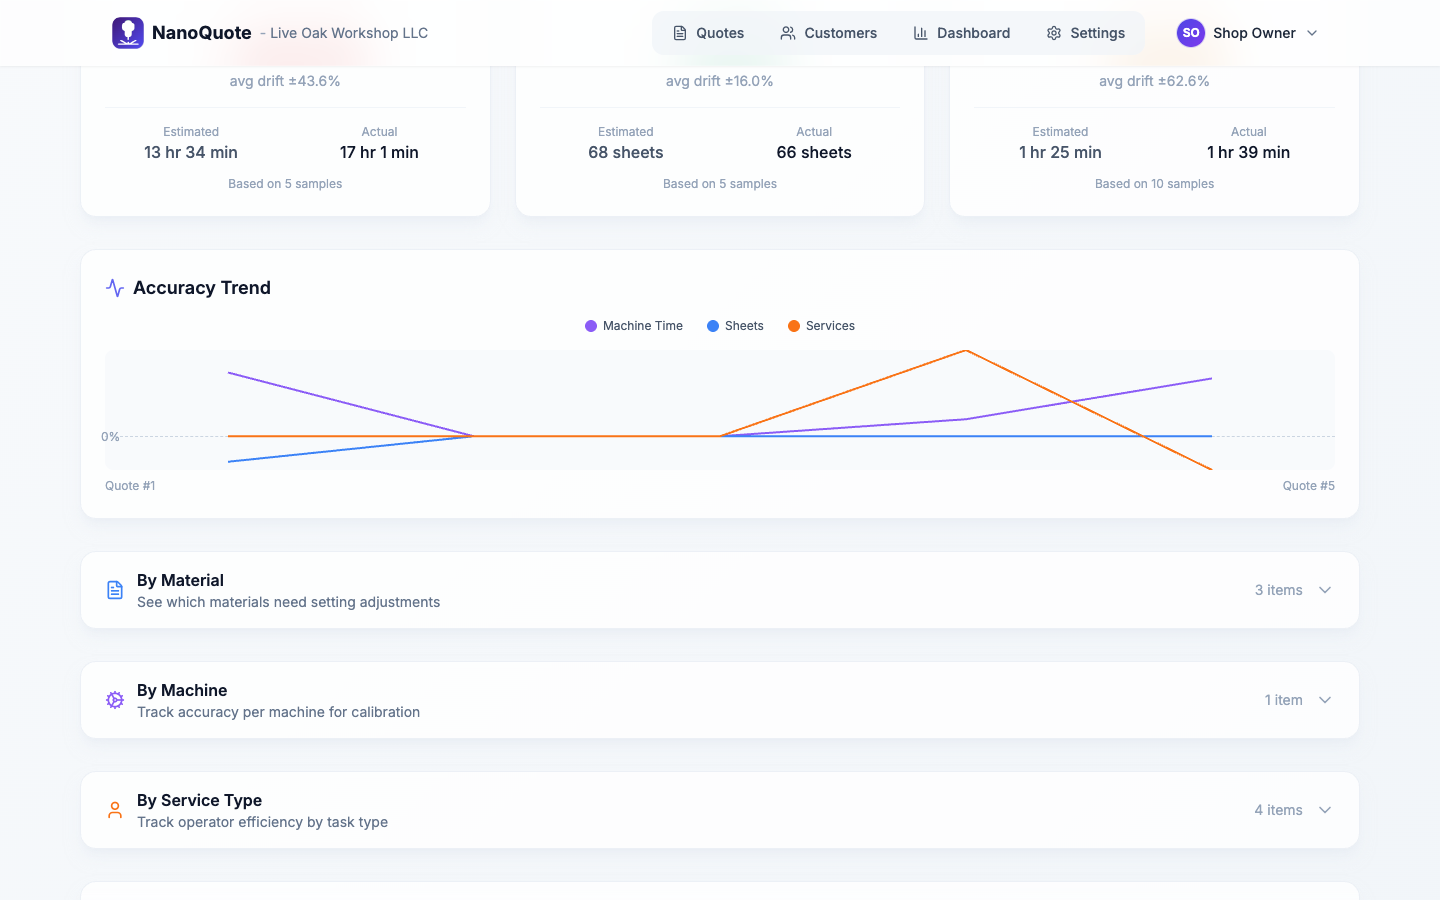
Trend chart
The trend chart shows accuracy for each individual quote in your selected window, helping you visualize patterns over time.
Use it to:
- Spot patterns across quotes
- Validate improvements after process changes
- Identify sudden shifts that need investigation
The chart displays three lines:
- Purple: Machine time drift
- Green: Sheet usage drift
- Orange: Service time drift
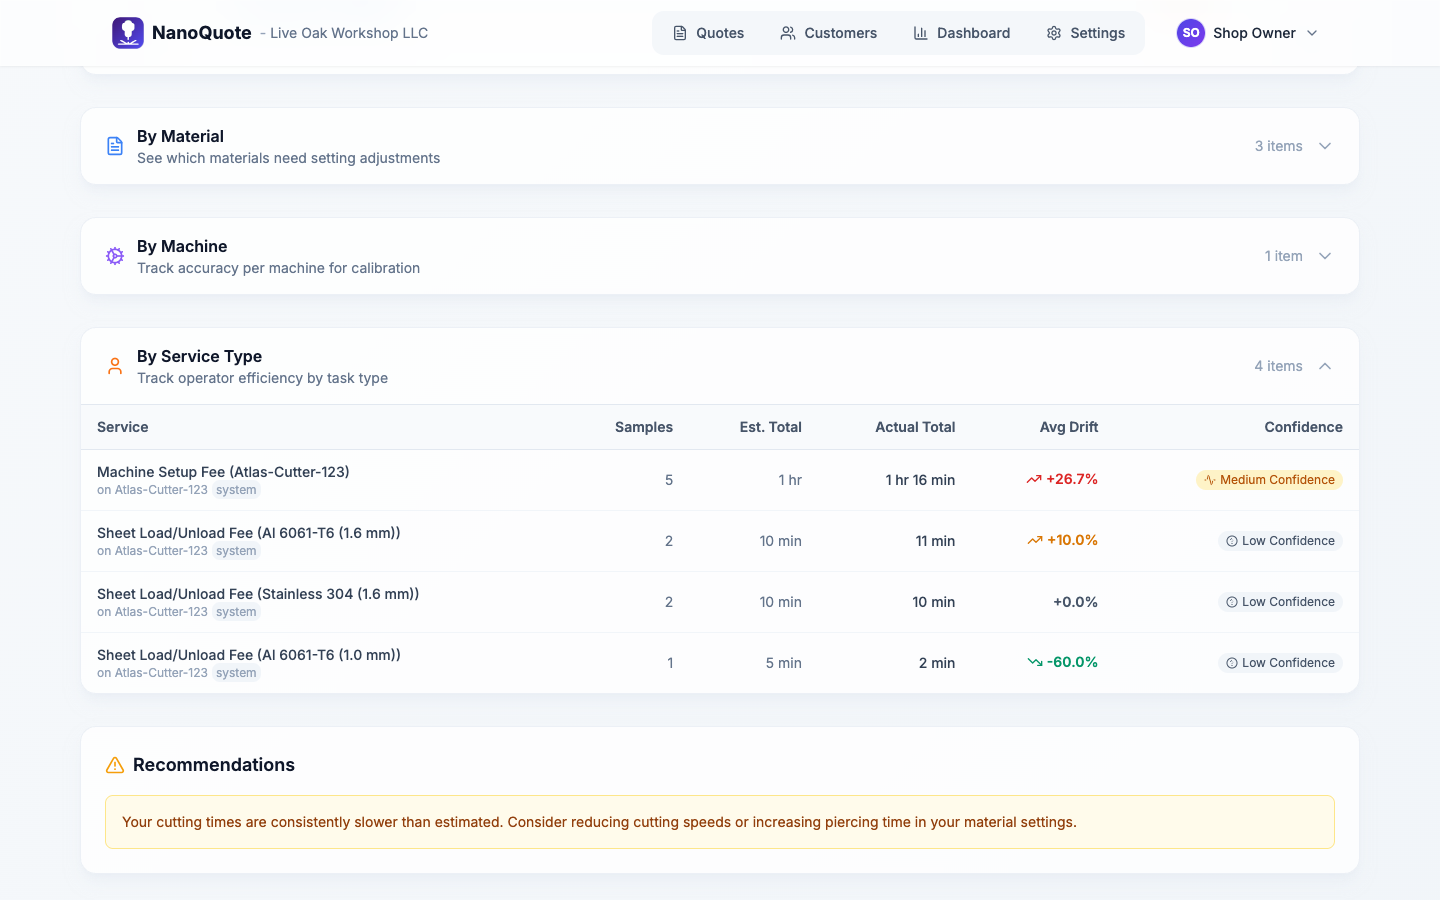
Breakdown sections
Expand the collapsible sections to see accuracy breakdowns by dimension:
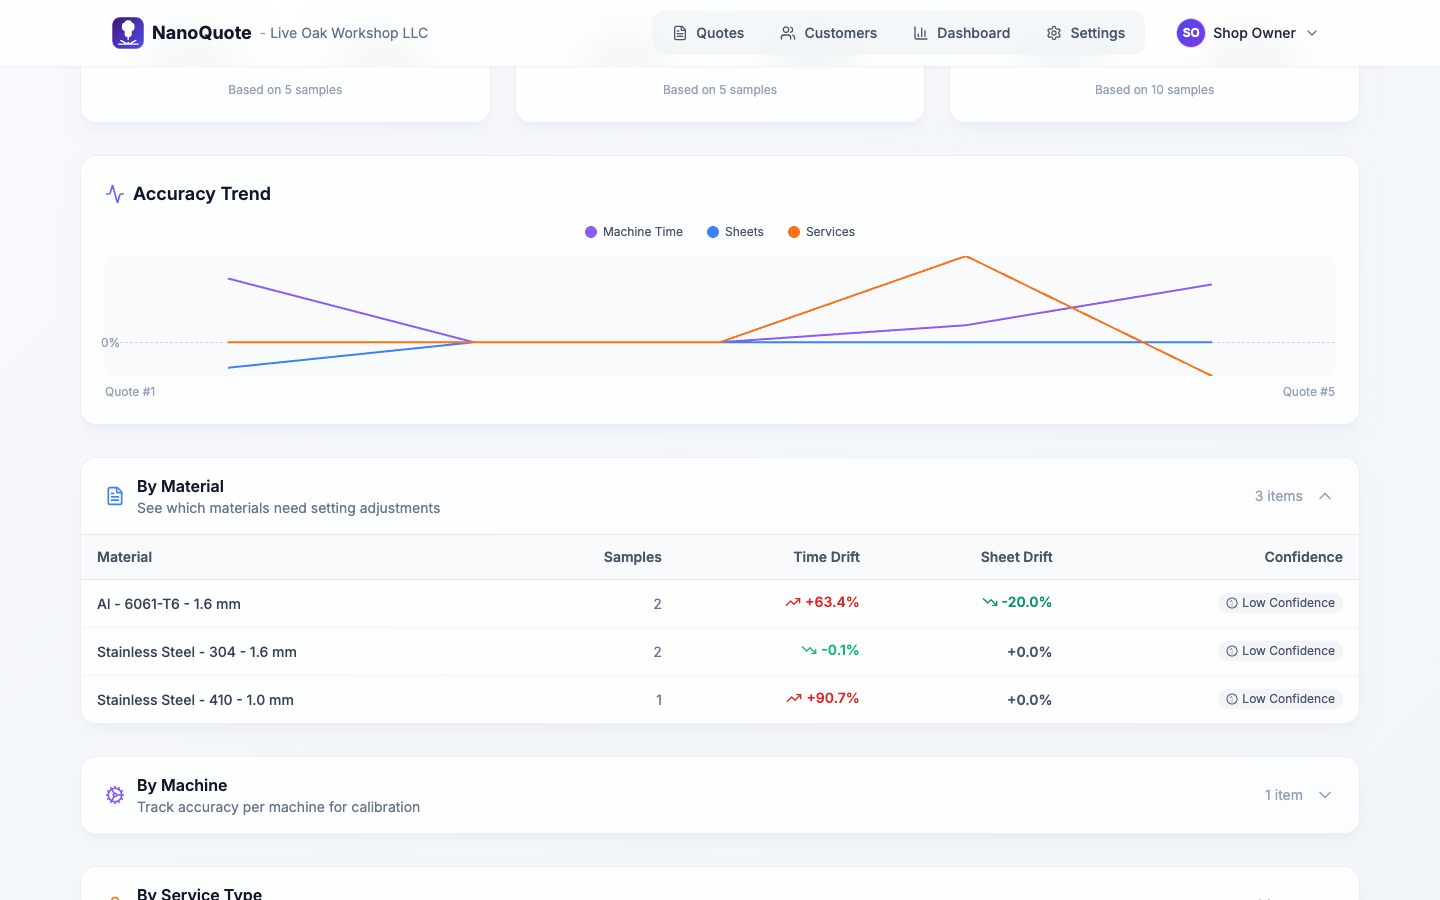
By Material
See which materials are hardest to estimate. Complex alloys or unusual thicknesses often show higher drift.
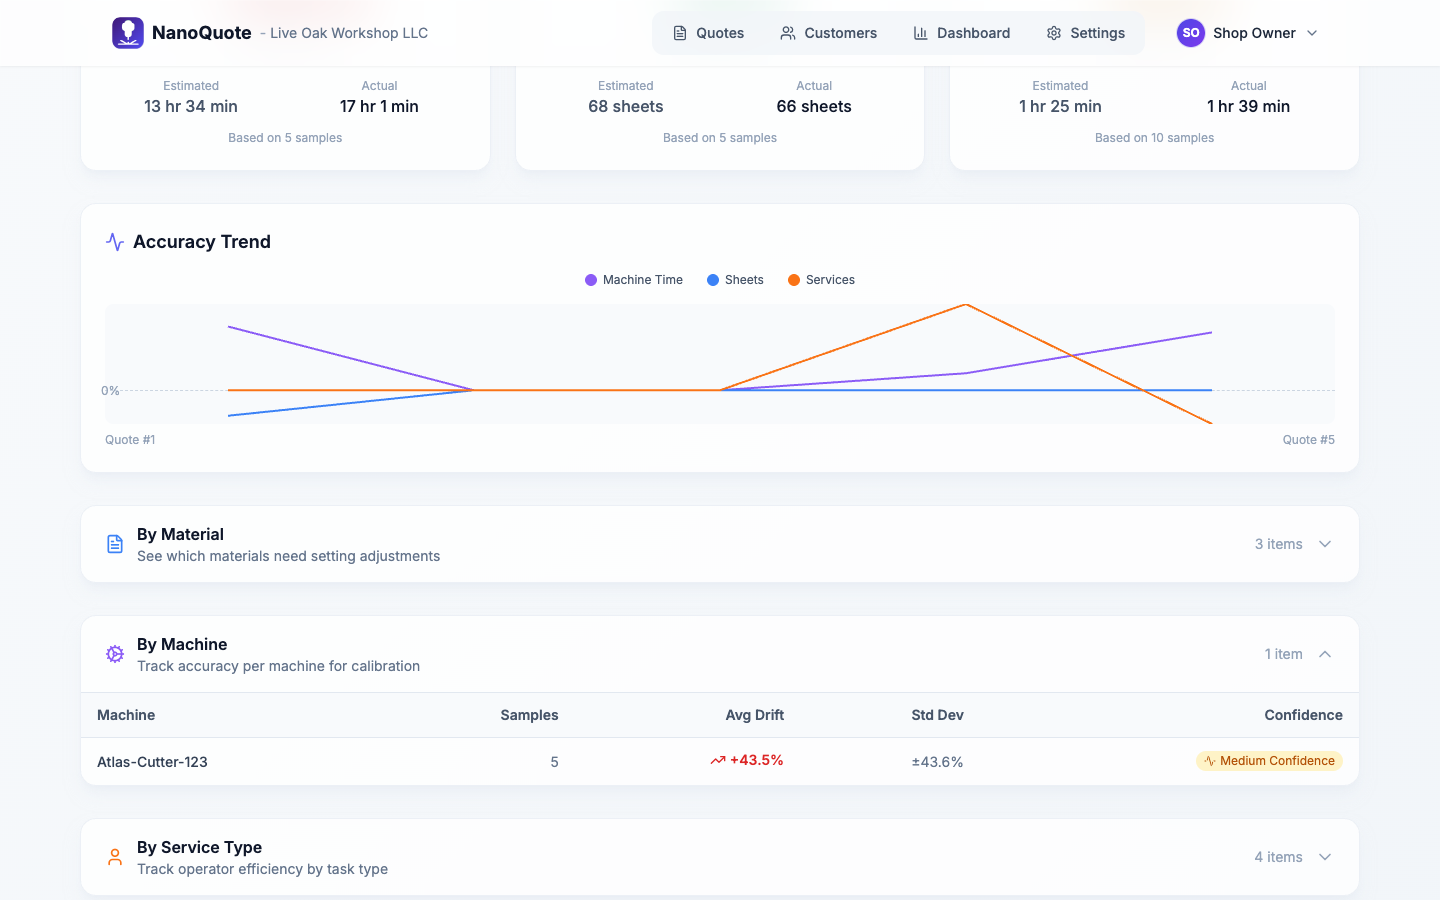
By Machine
Compare accuracy across your machine fleet. Different machines may have varying performance characteristics.
By Service Type
Identify services where time estimates need adjustment. Custom services often benefit from data-driven refinement.
Recording actuals
Accuracy data is captured when you complete a quote. The Quick Close modal prompts you to enter:
- Actual machine time (optional but recommended)
- Actual sheets used per material
- Actual time per service line
The more complete your data, the more valuable your accuracy insights become.
Tips for continual improvement
- Complete quotes consistently - Even partial actuals add value.
- Review weekly - Regular review catches drift early.
- Adjust estimates - Use data to refine material speeds, pierce times, or service rates.
- Train your team - Share insights so everyone quotes more accurately.
- Document changes - When you adjust parameters, note why for future reference.
Empty state
If you see "No accuracy data yet," it means no quotes have been completed with actuals recorded. Complete a few quotes with actual values to start building your accuracy baseline.