
Sales dashboard
Key metrics and recent activity for quoting performance.
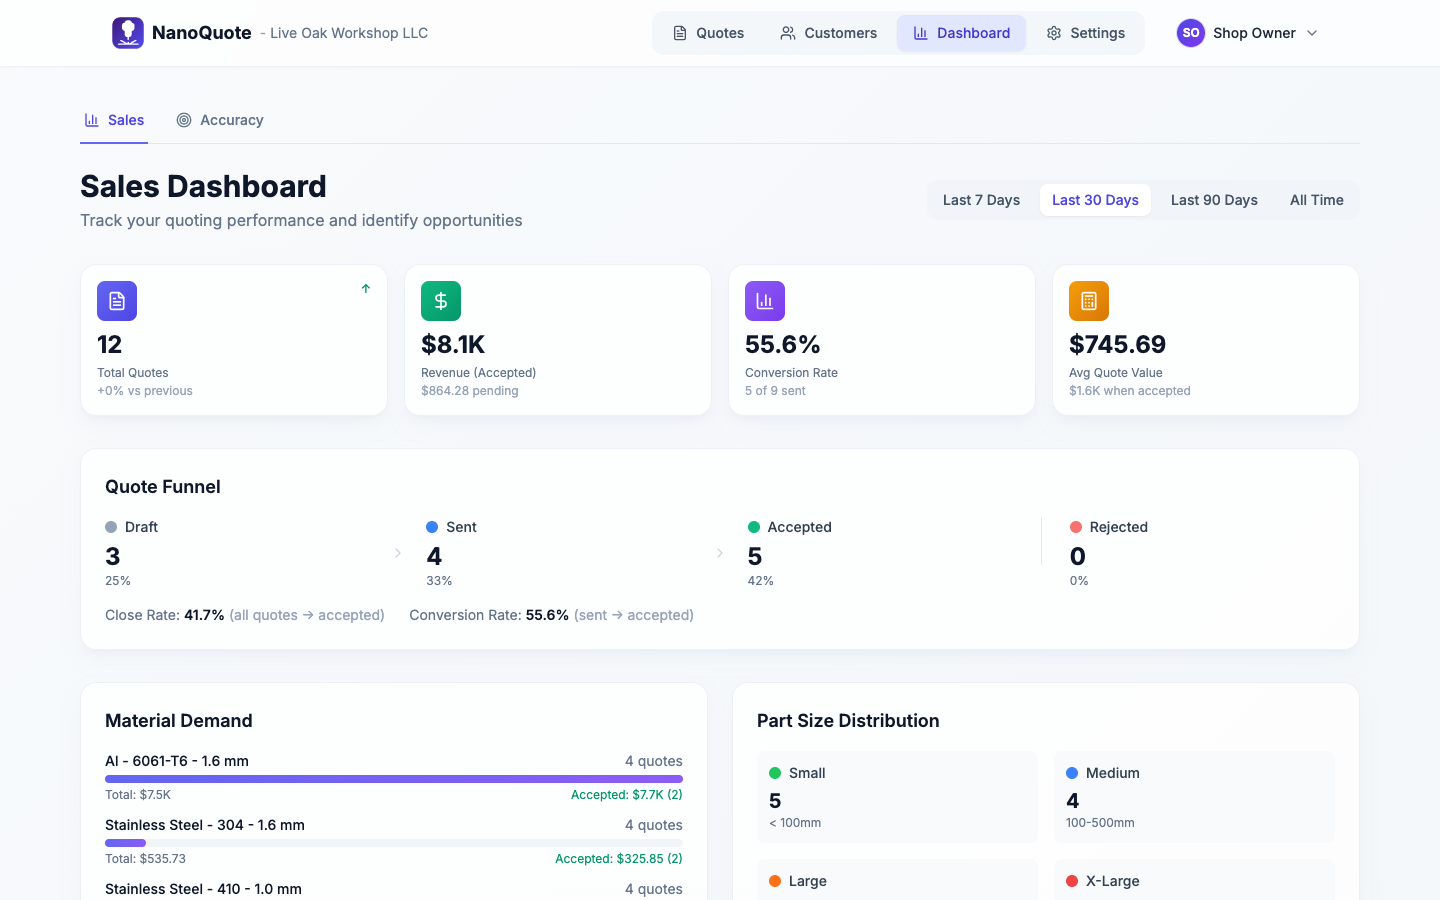
The Sales Dashboard summarizes quoting performance.
What you will see
Typical metrics:
- Quote funnel totals (draft/sent/accepted/rejected)
- Revenue totals (accepted and pending)
- Conversion and close rates
- Average quote value
The dashboard also highlights:
- Recent activity
- Top customers
Time range
Use the time range toggle to view performance over:
- 7 days
- 30 days
- 90 days
- All time
Tips
- Use the funnel to spot where quotes stall (sent but not accepted).
- Review recent activity for follow-ups or status updates.